
Not all Sales Key Performance Indicators (“KPIs”) are created equal. Because KPIs serve as a measure of business success and failure, selecting the right KPIs is critical. KPIs help companies adjust execution to achieve the desired outcomes. Better outcomes lead to better results.
Because KPIs are so important there are ample articles, stories and posts that suggest which measures and metrics are the most important. A Google search yields titles that include:
- 5 KPIs That Matter for Your Bottom Line
- 8 KPIs to Improve Your Marketing and Sales
- 8 KPIs that Actually Matter and How to Measure Them
- 13 Most Important KPIs for Sales Success
- 14 Proven Public Relations KPIs That Matter
- 18 Sales KPIs for Modern Sales Teams
- 19 Social Media KPIs You Should Be Tracking
- 21 Sales KPIs for Sales Teams to Track
- 28 KPIs Every Sales Manager Should Measure
- 35 KPIs that Span the Entire Customer Lifecycle
If you are in Marketing, then marketing KPIs will be most important. If you are in Finance, then financial KPIs will be most important. And, if you are in Sales, then sales KPIs will be most important.
The Importance of Key Performance Indicators
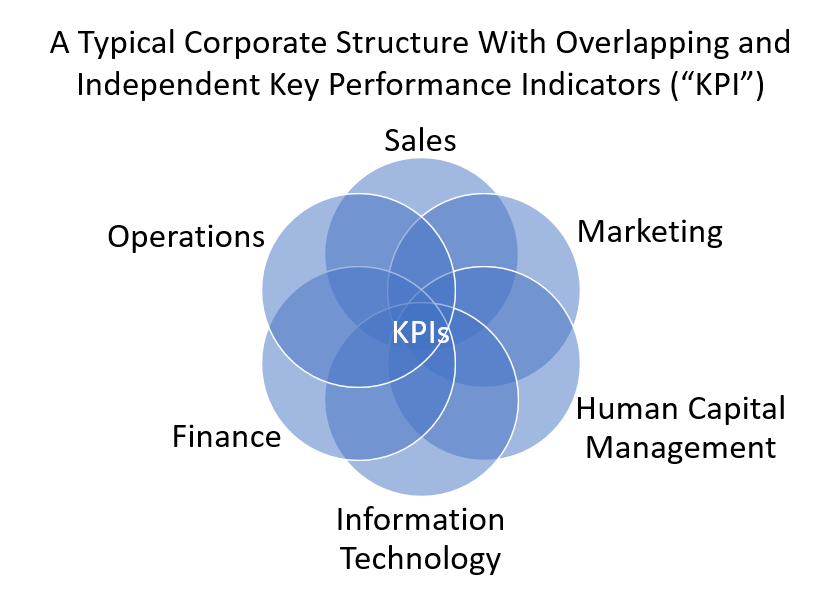
KPIs help management monitor company health, measure progress towards goals, make adjustment in execution, uncover insights from time-based patterns, and help overcome obstacles and solve problems leading to success. In many areas of the company KPIs overlap. For example, Closed Won Deal Volume and Average Order Value in the Sales department overlaps with Revenue Recognition and Profitability as measured by the Finance department.
The diagram (below) portrays the hypothetical overlap of KPIs among different departments in a typical corporate structure. Each department will have unique KPIs, a few will be shared with adjacent departments, and an even fewer will overlap across all departments. It is at the core of this illustration you are likely to find the KPIs used at the executive team and the senior managers in the organization for monitoring and measuring the progress of a company towards its goals.
Selecting KPIs for Sales
Sales KPIs are a unique subset of all company measures and metrics. These KPIs focus on lead generation and sales results. They measure prospecting and conversion strategies, sales motions, pipeline generated, closed won deals, and the like.
Sales KPIs will focus on upper funnel activity as well as down funnel activity. Upper funnel activities are those activities concerned with prospecting for new customers while down funnel activities are those that involved closing deals.
In addition to unique KPIs that are only of interest to Sales there will are measures and metrics that overlap with other departments, most often with Marketing and Operations.
One such KPI is Campaign Performance which will be of interest to Marketing. Marketing will want to know that Sales is converting and closing enough Leads from any given Campaign. But Sales will want to know that Marketing is generating enough Leads from Campaign to meet their sales quotas. This KPIs links the performance of these two departments and can yield valuable intelligence as to how will the company is doing.
Some examples of KPIs that are at the intersection of Sales and more on Marketing include: brand engagement, customer satisfaction, customer lifetime value and retention. Several examples of KPIs that are at the crossroads of Sales and Finance include: sales volume, sales cycle length, revenue, net profit, margin, and others. There are dozens of measurements that intersect with Sales and other departments measuring all aspects of the customer lifecycle measuring from acquiring and servicing to retaining.
Upper Funnel Sales KPIs
Upper funnel KPIs focus on prospecting and most often focus on quality and conversion metrics. They include:
- Automation Qualified Lead (“AQL”) to MQL Conversion
- Marketing Qualified Lead (“MQL”) to HQL Conversion
- Highly Qualified Lead (“HQL”) to SQL Conversion
- Sales Qualified Lead (“SQL”) to SAL Conversion
- Sales Accepted Lead (“SAL”) to Opportunity
Upper funnel KPIs also focus on the aspects of prospecting motions (usually activity based) and include:
- Speed to Qualification
- Calls and Connects
- Emails and Replies
- Social Outreach and Engagement
Upper funnel metrics track lead creation and progression towards opportunity. These metrics usually track the quantity at and conversion between each stage in the upper sales funnel. Activity in the upper funnel is conducted by Lead Qualification Representatives (“LDR”), Business Development Representatives (“BDR”), and Sales Development Representatives (“SDR”). Where LDRs are engaged in prequalification prospecting, such as determining which prospect might match the company’s Ideal Customer Profile (“ICP”) when using an account-based strategy and attach plan for new company logo acquisition initiatives. The BDRs and SDRs conduct deeper conversations with prospects identifying needs, timing, and budgets. They will often set appointments for the field and inside sales teams.
Speed to Qualification is referred to as Speed to First Touch but the two should not be confused. Speed to Qualification is overlooked and is an important metric because it measures how fast prospect traverse the upper phases of the sales funnel. There is often a lot of focus on Sales Cycle length — from opportunity to close — but not the same attention is given to the length of time it takes to convert a lead to an opportunity. It is obvious how important it is to reach out to leads as soon as there is engagement, for example when prospects complete a “contact me” form. The sooner the sales team begins outreach, the higher the likelihood of connection and subsequently conversion. Speed to First Touch is only the first step in measuring Speed to Qualification. And knowing how fast prospects convert in the upper funnel can yield valuable insights into sales efficiency within the sales team.
Down Funnel Activity
Down funnel KPIs focus on selling and most often focus on opportunity stages and conversion ratios. They include:
- Opportunity Progression (stages from creation through closed won or lost)
- Configuration, Quotation and Pricing (often referred to as “CQP”)
- Opportunity-to-Win Ratio
- Average Deal Size and Average Order Value
- Sales Cycle and Opportunity Age
- Deals Outcomes
- Sales Revenue Generated
Lower funnel KPIs also focus on the aspects of sales motions (usually activity based) and include:
- Appointments Set and Held
- Demo Delivered
- Quotes and Contracts Generated
Lower funnel metrics track opportunity creation and progression towards closed won. These metrics usually track the quantity and conversion between each stage in the lower sales funnel. They are the opportunity stages, such as Discovery and Needs Analysis, Evaluation and Proposal, Negotiation and Closing, followed by (hopefully) closed won or (hopefully not) closed lost. Activity in the lower funnel is conducted by Field Sales Representatives (“FSR”), Inside Sales Representatives (“ISR”), and Account Executives (“AE”). Where the ISRs are often engaged with prospects where the value proposition is delivered via a phone call or Zoom meeting.
The Link Between Sales and Marketing
HQL conversion is the action that fulfills the Service Level Agreement (“SLA”) between the Marketing and Sales departments. It will include leads that matches the Ideal Customer Profile (“ICP”) and have shown a level of interest (think lead scoring) in the company and its products and services. These leads have done more than just engage with company assets. They have been qualified using methodologies like BANT (which is the acronym for Budget, Authority, Need, and Timing — a qualification methodology of which there are a dozen or so different ones). And upon qualification they pass onto the sales team.
The Link Between Sales and Finance
Opportunities that progress to closed won fulfill the SLA between Sales and Finance. This will include opportunities that gone through configuration, pricing, and quote (along with any internal approvals from Finance, Legal, and other departments). And upon closing the deal they passe to the delivery team, implementation team, or order fulfillment (depending upon the nature of the products and services the company offers).
Making Heads and Tails Out KPIs
If you cannot make heads or tails of which KPIs to track you are not alone. Dashboards group together similar or different KPIs. For example, a dashboard intended for the executive leadership (those in the C-Suite) is likely to look quite different than a dashboard utilized by a Business Development Representative (“BDR”).
Executive leadership is interested in financial scoreboards that measure:
Pipeline:
- Open Deals and Value to target
- Month-over-month trending
Revenue:
- Monthly revenue to target
- Month-over-month trending
Sales leadership is interested in action scoreboards that measure
Leading Indicators
Leading indicators are those measures and metrics throughout the sales funnel that provide directional trends based on activities performed (as opposed to outcomes). They answer the question: Are we conducting enough activity to meet our revenue goals? Leading indicators could include:
- Calls and connects
- Emails and replies
- Social connections
When leadership and the LDRs, SDRs, and BDRs focus on these measures (often logged daily, summarized weekly, with trending overtime), the organization will be able to determine if they need step up the pace in order to make forecasted revenue targets.
Lagging Indicators
Lagging indicators are those measures and metrics throughout the sales funnel that provide trend data based on outcomes (as opposed to actions). They answer the question: Are we achieving sufficient outcomes to meet our revenue goals? Lagging indicators could include:
- Meetings Set
- Meetings Held
- Opportunities Created
When leadership and the ISRs, FSRs, and AEs focus on these measures (often measured weekly along with trending), the organization will be able to determine if they will make their forecasted revenue goals.
What Is Measured Improves
Karl Pearson is quoted as saying: That which is measured improves. Peter Drucker is quoted as saying: What is measured improves. And, Lord Kelvin is quoted as saying: If you can not measure it, you can not improve it.
Measurements and metrics alone are not enough. Understanding how to turn KPIs into actionable insights is one of the keys to success. Once actionable insights are determined, taking action is the next key. Inspecting what you expect leads you to the next key. And, the last key is to remeasure and recalibrate based on findings.
Self-fulfilling Prophecies
Beware of self-fulfilling prophecies. What you choose to focus on will improve and managers can be lulled into conducting more of that activity to the exclusion of other activity. If there is a market shift, such as a new competitor on the scene or introduction of an innovative technology, continuing to do the same thing and expecting a different result is — as they say — ludicrous.
When Is Too Much Data Too Much?
There are so many different KPIs that it can be hard to choose which ones are right for your organization. In a data-driven world select those KPIs that give you the best insights into your team’s performance. Businesses effectively use dashboards to manage enormous quantities of information in the hopes of turning KPIs into actionable insights. When used correctly, dashboards can help managers spot trends and react quickly.
In Conclusion
The right KPIs will yield insights into the sales team’s performance. It will help you identify areas needing improvement. KPIs can help you focus training and coaching resources. KPIs can aid in sales process optimization. And KPIs can inform on outcomes from tactical and strategy initiatives. Choose the best KPIs for your business and watch sales soar.
About the Author

Stephen Howell is a multifaceted expert with a wealth of experience in technology, business management, and development. He is the innovative mind behind the cutting-edge AI powered Kognetiks Chatbot for WordPress plugin. Utilizing the robust capabilities of OpenAI's API, this conversational chatbot can dramatically enhance your website's user engagement. Visit Kognetiks Chatbot for WordPress to explore how to elevate your visitors' experience, and stay connected with his latest advancements and offerings in the WordPress community.