If you are looking out the windshield, you are watching the road ahead. You are considering what is coming at you on the highway. If you are looking out the rearview mirror, you are observing what has already happened. You are noticing what has already based you by. And if you are looking out the side windows you are gazing at those going the same way you are.
The analogy is helpful for understanding leading and lagging sales key performance indicators (“KPI”). Leading indicators such as calls made, emails sent, or demos delivered are metrics that come before the deals your sale team is likely to close. Lagging indicators such as booked revenue and closed won ratio are metrics that come after the deals your sales team has closed. They inform you about what your team has accomplished.
An indicator is a quantitative representation of a qualitative success factor. Indicators measure effort (calls made) and outcomes (opportunities closed won). Think: inputs and outputs. The sales team makes calls, connects with prospects and customers. Opportunities created result in closed deals generating revenue for your business.
So, which do you choose? Leading indicators? Lagging indicators? Or both? The simple answer is it depends on what you want to accomplish. If you are focused on the end results – and who is not – then you start with lagging indicators and work backwards from there.
It all comes down to which success factors are important for your business. What is measured can be improved. Knowing what success looks like for you and focusing on those factors will inform you as to which indicators – leading, lagging or both – to measure and monitor.
What are leading sales key performance indicators?
Leading sales KPI are measures and metrics that predict company performance. Leading indicators are used to forecast outcomes. They let you know if you and your sales team are on track.
Periodic review of leading indicators will help you determine if you are on track. And if not, what adjustments are needed. They express what might happen, but they are not always right. They suggest trends. And trends can be reversed with action provided you know what is happening.
Sales leading indicators are those measures that inform you about the sales team’s current and future performance. Leading indicators can be used to figure out if the team is likely to achieve their sales targets and revenue goals.
Leading indicators give you the opportunity to do something before it is too late. They give you insights into areas where you can coach your sales team for success.
What are lagging sales key performance indicators?
Lagging KPI are measures and metrics that reflect actual company performance. Lagging indicators assess the current and past state of the business. They measure end-state goals and desired outcomes. They let you know if your sales team achieved what they set out to do.
Periodic review of lagging indicators will help you decide if you are on track. And if not, like leading indicators, what adjustments are needed now or in the future. They express what happened and are the historic record of your sales team’s performance.
Like leading indicators, lagging indicators are those measures that inform about the sales team’s past performance. They let you know what your sales team did, not what they are likely to do. And they can be used for trend analysis.
Unlike leading indicators, with lagging indicators it is already too late. “Alea iacta est.” as Julius Caesar said after crossing the Rubicon River. The die has been cast. The outcome is already decided.
Calculating Basic and Compound Indicators
How are basic and compound indicators computed? What is the difference between them?
The most basic method of computing indicators is simply to count them; the total number of calls made today was one hundred, the total number of opportunities creates was twenty. This simple approach assesses frequency.
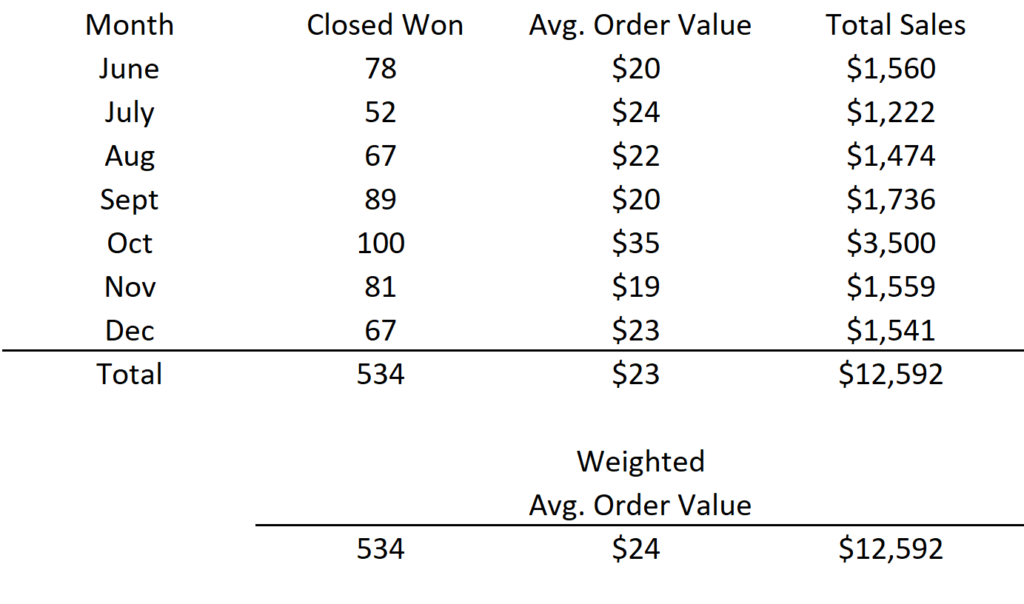
Another method of calculating leading indicators is to use a weighted average. Some data will have a higher weight than other data. This approach can provide insights into trends. Calculating an average is simple. You add up the numbers and divide by the count. You can average the order value over time or across your sales team. You will find that the average order value is slightly lower than the weighted order value. In the example below the average order value is $23. However, the weighted order value is slightly higher at $24. When forecasting revenue, you might use one or the other. Knowing the difference will help you know in advance if you will reach your sales target.
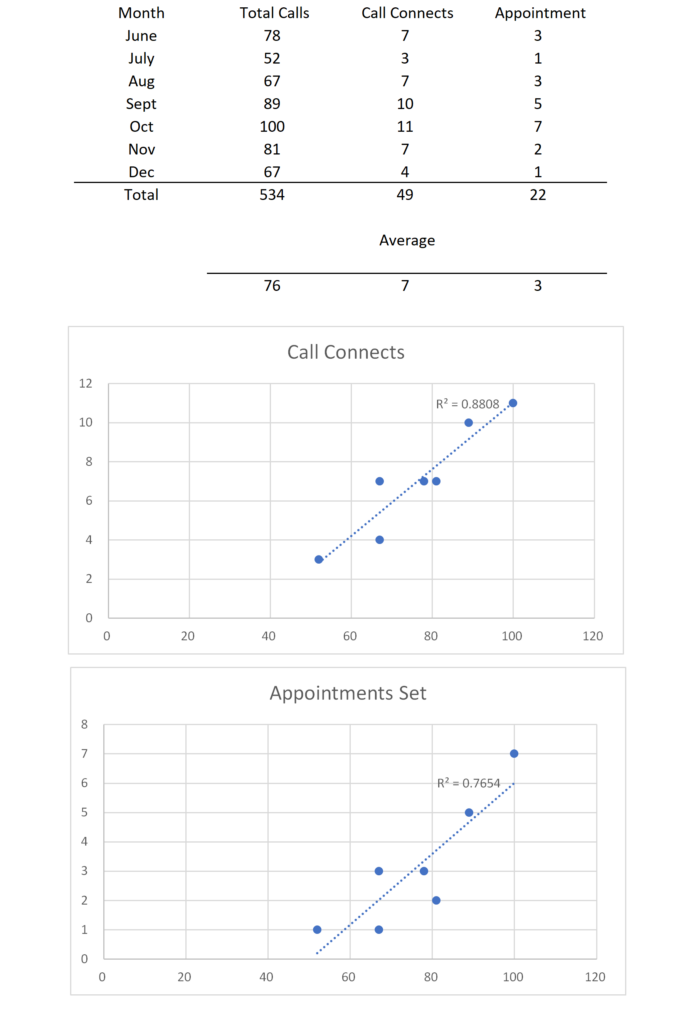
There are other common statistical methods that can be used. For example, calculating the correlation coefficients between to measures. The strength of the relationship between one measure (such as calls) and another measure (such as appointments set) can be computed using the correlation coefficient function found in tools like Excel. Strong or weak relationships are easily detected using common statistical method such as correlation. Correlations suggest cause and effect and are useful when exploring inputs (actions) and outputs (results) such as call connections and appointments set. But beware, it is easy to confuse causality with correlation. It is easy to see the relationship between calls and call connects in the graph below. The R2 value is remarkably high at 0.8808 suggesting a high correlation between making call and connecting with prospects. But the R2 value for Appointments Set is only 0.7654 which suggests a slightly weaker relationship between calls and appointments. Interestingly the R2 value between call connects and appointments is slightly higher at 0.8982 and is as expected. The assumption is that if you call a prospect and connect with them that you will set an appointment; cause and effective (but more on that later).
Compound leading indicators are those where two or more indicators are combined and are most often expressed as ratios or percentages (such as conversion rates between sales funnel stages, i.e., MQL-to-SQL Conversion or Open Opps-to-Closed-Won). Compound indicators are relative rather than absolute. For example, if you have ten leads and five closed sales, you have a 50% close rate. The same holds true if you have five hundred leads and 250 closed sales, you still have a 50% close rate.
Count, frequency, average, percentage, and correlation the most common indicator calculations. The math may be simple, but interpretation can be illusive. Drawing conclusions and generating insights based on the data should result in better decisions. Sussing out the meaning behind all the indicators is the holy grail of sales analytics.
Examples of Leading Indicators
The following is a list of partial leading indicators:
- Leads
- Created
- By Status
- Activity
- Calls
- Call Connects
- Emails
- Replies
- LinkedIn Connection Requests
- LinkedIn Connection Requests Accepted
- Sales Cadence Steps
- Completed
- Skipped
- Postponed
- Meetings and Demos
- Scheduled
- Held
- Canceled
- Rescheduled
- Opportunities
- Created
- Average Opportunity Size
- Number of New Quotes
- Sales Cycle Length
- From Created Date to Close Date
- From Stage to Stage (Deal Progression and Stage Yield)
Examples of Lagging Indicators
The following is a partial list of lagging indicators:
- Opportunities
- Number of Closed Won
- Number of Closed Lost
- Win-Loss Ratio
- Revenue
- Average Order Value
- Won Amount
- Lost Amount
- Profit
- Margin
- From Existing Customers/Clients
- From New Customers/Clients
So, which do you Choose: leading, lagging, or both?
It is obvious that anyone benefits from tracking leading and lagging business indicators. Doing so allows for data-based decision making. Measuring and monitoring leading indicators provides early signals for improved business oversight and management. Measuring and monitoring lagging indicators shows if outcomes are progressing in the right direction. The objective of KPIs is to obtain a 360-degree picture of how your sales team is performing, identifying areas of improvement, and then taking the necessary steps and actions based on findings.
Three simple but powerful questions add clarity and focus:
- Is the indicator measurable?
- Is it understood how to use and explain the indicator?
- Is it understood how to apply it to managing the business?
Leading and lagging KPIs give you visibility into your sales process. They allow you to identify opportunities for improvement. Once you have a detailed picture of your sales pipeline and sales revenue, you can focus on the people, process, systems, and data to increase the overall likelihood of success and profitability.
So, it really all comes down to which success factors are important for your business. What is measured can be improved. You simply cannot ignore the facts hidden in your data. Your data does not lie. Correlation does not equal causation. Knowing what success looks like for you, your sales tea, and your organization allow you to make data-driven decision based on those factors informed by key performance indicators – leading, lagging or both – that you can measure, derive, and monitor.
About the Author

Stephen Howell is a multifaceted expert with a wealth of experience in technology, business management, and development. He is the innovative mind behind the cutting-edge AI powered Kognetiks Chatbot for WordPress plugin. Utilizing the robust capabilities of OpenAI's API, this conversational chatbot can dramatically enhance your website's user engagement. Visit Kognetiks Chatbot for WordPress to explore how to elevate your visitors' experience, and stay connected with his latest advancements and offerings in the WordPress community.